Multispectral imaging camera sensors on agricultural drones allow farmers to manage crops, soil, fertilization, and irrigation more effectively. By minimizing the use of sprays, fertilizers, and water waste while simultaneously increasing crop yields, this offers significant benefits to farmers and the wider environment.
Multispectral camera remote sensing technology captures visible and invisible images of crops and vegetation using green, red, red-edge, and near-infrared bands. Multispectral images are integrated into software applications that output the information as meaningful data. This land telemetry, soil, and crop data enables farmers to save time and money more efficiently while reducing pesticide use.
In this article, we will introduce the basics of multispectral imaging technology, reflectance, bands, and vegetation indices (such as NDVI and NDRE), demonstrating how this information provides farmers with a deep understanding of soil and plant health.
We will also show you the latest multispectral sensors and agricultural drones that can be equipped with multispectral sensors.
Multispectral Imaging Agricultural Drones
Advantages of Multispectral Imaging
Multispectral images are a very effective tool for assessing soil productivity and analyzing plant health. Observing soil and crop health with the naked eye is very limited, outdated, and undesirable. Multispectral sensor technology can see more than the farmer’s naked eye.
The data produced by multispectral imaging offers the following benefits:
• Identifying pests, diseases, and weeds. Optimizing pesticide use and crop spraying through early detection.
• Providing data on soil fertility and optimizing fertilization by detecting nutrient deficiencies. Assisting in land management, such as deciding whether to produce or rotate crops.
• Counting plants and identifying crop quantity or planting spacing issues. Estimating crop yield.
• Measuring irrigation. Controlling crop irrigation by identifying areas suspected of water stress. Making land improvements based on multispectral data, such as installing drainage systems and waterways.
• Inspecting damage to crops from agricultural machinery and making necessary repairs or replacing problematic machinery.
• Surveying fences and farm buildings.
• Monitoring livestock.
Year-Round Solution
Multispectral imaging is highly effective, and this sensor technology can be used throughout the entire crop cycle. When used during planting, irrigation, fertilization, or harvesting, multispectral imagery provided by drones can help farmers effectively manage crops at every step throughout each season.
Through advanced multispectral sensors and imaging capabilities, new methods are provided to farmers to increase yields and reduce crop damage.
Multispectral Camera Remote Sensing Drones
Survey/Inspection/3D Mapping/Multispectral Imaging
Before we delve further into the topic of multispectral imaging technology in agriculture, one of the most fundamental tasks on any farm is to clearly inspect crops, fences, and buildings.
Top-tier drones for this type of work need to have Global Positioning System (GPS), First Person View (FPV), a stable gimbal, an excellent camera, and even autonomous waypoint navigation.
Multispectral Imagery from the DJI Inspire 1
The DJI Inspire 1 is one of the most innovative drones on the market today, suitable for any farm. This drone features excellent stabilization technology and a 4k camera. The Inspire 1 will provide you with perfectly clear video and visual inspection images of your entire farm. The Inspire 1 has many intelligent flight modes, including waypoint design. Using Pix4D software and waypoints, you can create a 3D photogrammetric map of your land.
Multispectral Imaging Technology
What is a Multispectral Image?
Multispectral image sensors capture image data at specific frequencies across the electromagnetic spectrum. These wavelengths can be separated using filters or by using instruments sensitive to specific wavelengths, including light from frequencies outside our visible range, such as infrared. Spectral imaging can also extract other additional information that the human eye cannot capture.
The Importance of Multispectral Images
The human eye is only sensitive to wavelengths between 400 and 700 nm, which is known as the visible spectrum. People can perceive a range of colors from purple to red. However, light wavelengths can be shorter (ultraviolet) or longer (infrared) than what our visible vision can perceive.
Although we cannot see them, these invisible bands are excellent at revealing the agronomic characteristics of soil, plants, and crops.
Multispectral Imaging in Agriculture
Multispectral Imaging Basics
Every object surface reflects some of the light it receives, and objects with different surface characteristics reflect or absorb solar radiation in different ways. The ratio of reflected light to incident light is called reflectance and is expressed as a percentage.
Vegetation Indices
Vegetation reflectance properties are used to derive vegetation indices (VIs), which are used to analyze various ecosystems. Vegetation indices are composed of reflectance measurements at two or more wavelengths to analyze specific characteristics of vegetation, such as total leaf area and water content.
Vegetation interacts with solar radiation differently than other natural materials such as soil and water bodies. The absorption and reflection of solar radiation is the result of many interactions with different plant materials, which vary significantly with wavelength.
Water, pigments, nutrients, and carbon each exhibit distinct, often overlapping but spectrally different, reflectance behaviors in the reflectance spectrum from 400 nm to 2500 nm. These known characteristics allow scientists to combine reflectance measurements at different wavelengths to enhance specific vegetation characteristics by defining VIs.
Although more than 150 vegetation indices have been published in the scientific literature, only a small fraction have a significant biophysical basis or have been systematically tested. The most commonly used vegetation index is NDVI (Normalized Difference Vegetation Index), and NDRE (Normalized Difference Red Edge) is also very common. Sentra’s single sensor has an optional NDRE filter.
NDVI Vegetation Index
The Normalized Difference Vegetation Index (NDVI) is a measure of plant “greenness” or photosynthetic activity, and is one of the most commonly used vegetation indices. Vegetation indices are based on the observation that different surfaces reflect different types of light.
Specifically, photosynthetically active vegetation absorbs most of the red light while reflecting most of the near-infrared light. Dead or stressed (unhealthy) vegetation reflects more red light and less near-infrared light. Similarly, non-vegetated surfaces have a more uniform reflectance across the spectrum.
By taking the ratio of red and near-infrared bands from remote sensing images, a vegetation index of “greenness” can be defined, and the Normalized Difference Vegetation Index (NDVI) is perhaps the most common of these vegetation indices. NDVI is calculated on a per-pixel basis as the normalized difference between the red and near-infrared bands from the image.
NDVI can be calculated from any image with red and near-infrared bands, and its biophysical interpretation is the fraction of absorbed photosynthetically active radiation.
Many factors influence NDVI values, such as plant photosynthesis, total plant cover, biomass, plant and soil moisture, and plant stress. Therefore, NDVI is related to many agricultural and ecosystem attributes of interest to researchers and managers (e.g., net primary productivity, canopy cover, bare ground cover).
Furthermore, because it is a ratio of two bands, NDVI helps compensate for differences in illumination in images due to slope and aspect, and for differences between images, such as the time or date when the images were acquired. Therefore, vegetation indices like NDVI allow for the comparison of images over time to look for agriculturally and ecologically important changes. NDVI Crop Management Advantages
• Canopy cover and density detection
• NDVI provides accurate growth trends over time
• Frost damage detection
• Large-scale pest and disease detection
• Optimization of crop rotation duration
• Ecological benefits
• Vegetation dynamics or plant phenological changes over time
• Biomass production
• Grazing impacts or attributes related to grazing management (e.g., stocking rate)
• Changes in pasture conditions
• Vegetation or land cover classification
• Soil moisture
• Carbon sequestration or CO2 flux (Although other physical processes are involved in soil respiration, CO2 movement or CO2 flux in the soil is the main function of soil respiration. Soil carbon dioxide flux is an important component of the total atmospheric carbon balance and is a very important variable in global climate change research. Soil respiration is also an important indicator of soil biological health and vitality, and is an excellent tool for assessing the effectiveness of bioremediation efforts and the impact of changing agricultural practices.)
NDRE Vegetation Index
The Normalized Difference Red Edge Index (NDRE) is a measure that can be used to analyze vegetation health in images obtained from multispectral image sensors. It is similar to the Normalized Difference Vegetation Index (NDVI), but uses the ratio of near-infrared and red edge.
NDRE uses a red edge filter to view the reflectivity of the crop canopy. The red edge is a region in the vegetation reflectance spectrum in the transition band from red light to near-infrared (NIR), marking the boundary between chlorophyll absorption in the red visible region and scattering by the internal structure of the leaf in the NIR region. This allows you to manage crops by determining many different variables. By understanding chlorophyll levels, we can monitor photosynthetic activity.
With this information, you can optimize harvest timing based on changes in photosynthetic activity. During the harvest period, situations similar to the following occur: the separation of the hull in almonds or the maximum sugar content in grapes changes significantly with the NDRE value. This change occurs because when the fruit/nut reaches maturity, the sugar molecules produced by photosynthesis are no longer needed in such high demand. This relationship provides you with a crop management tool for harvest scheduling to obtain the highest quality product. Other factors, such as insect infestations, can also alter chlorophyll content and cause crop stress. Therefore, by using NDRE, you can determine how severe a mite outbreak is in an almond area and then use precise methods to terminate the infestation. This not only monitors the outbreak but also reduces costs associated with pest and disease control.
Multispectral Software Applications
Many precision agriculture and crop stress tools and applications have now been built around VIs to provide complete solutions including the processing, storage, presentation, and analysis of multispectral data. Below is some information on relevant multispectral software applications.
Vegetation Spectra
The reflective properties of an object depend on the specific material and its physical and chemical state (e.g., moisture content), surface roughness, and geometric environment (e.g., angle of incidence of sunlight). The most important surface characteristics are color, structure, and surface texture, and the perceived color of an object corresponds to the wavelength of the visible spectrum with the maximum reflectance.
These differences make it possible to identify different earth surface features or materials by analyzing their spectral reflectance patterns or spectral signatures. These features can be displayed as so-called spectral reflectance curves as a function of wavelength.
The image below shows typical spectral reflectance curves for three basic types of earth features: green vegetation, dry bare soil, and clear water. Green, red, and infrared are the main ones used in agriculture. The red edge (corresponding to the short wavelength band at the entry point of near-infrared) is also sometimes used to obtain additional indicators. The vegetation spectral image is from Markelowitz, with more details and explanations of reflectance and vegetation bands below.
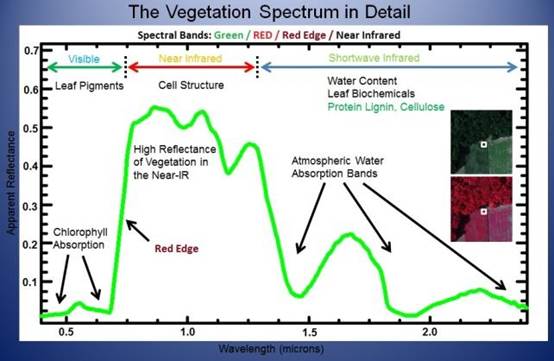
Vegetation Curve
The spectral reflectance curve of healthy green vegetation has a significant minimum reflectance in the visible part of the electromagnetic spectrum produced by pigments in the plant leaves. Healthy vegetation will absorb in the blue and red bands, producing what is called “green healthy vegetation.”
At the same time, the reflectance in the near-infrared increases sharply. Stressed vegetation can also be detected because the infrared reflectance of stressed vegetation is much lower.
Soil Curve
The spectral reflectance curve of bare soil does not vary much. The reflectance curve is affected by moisture content, soil texture, surface roughness, and the presence of iron oxides and organic matter. These factors are not as pronounced as the absorbance characteristics observed in the vegetation reflectance spectrum.
Water Curve
The water curve is characterized by high absorption in the near-infrared wavelength range and above. Due to this absorption property, water bodies and water-containing features can be easily detected, located, and delineated using remote sensing data. Turbid water has a higher reflectance in the visible light region than clear water.
The same is true for water containing high concentrations of chlorophyll. These reflectance patterns are used to detect algal blooms.
Multispectral Vegetation Bands
Green
Green corresponds to the reflected energy in the 500-600 nm spectral band and has the highest reflectance in this band. The reflectance peak is around 550 nm. This spectral band has been shown to be closely related to the amount of chlorophyll contained in plants.
In this visible portion of the vegetation spectrum, the reflectance curve of healthy plants has the highest reflectance in the green band (in the range of 550 nm). This is why plants appear green to us.
The compound in leaves called chlorophyll strongly absorbs radiation at red and blue wavelengths but reflects green wavelengths. Leaves are most “green” to us in the summer when chlorophyll content is highest.
In the fall, there is less chlorophyll in the leaves, so there is less absorption and proportional reflection of red wavelengths, making the leaves appear red or yellow (yellow is a combination of red and green wavelengths).
The internal structure of healthy crops acts as an excellent diffuse reflector of near-infrared wavelengths. Measuring and monitoring near-infrared reflectance is one way to determine how healthy (or unhealthy) vegetation is.
Most of the light in the visible spectrum reflected by plants under stress is in the green range. Therefore, to the naked eye, stressed plants are indistinguishable from healthy plants. On the other hand, differences can be seen in the reflectance of light in the infrared range, but this is far from sufficient.
Red
This corresponds to the reflected energy in the 600-700nm spectral band, which is heavily absorbed by chlorophyll in this band, resulting in low reflectance. Reflectance varies greatly depending on factors such as biomass, LAI (Leaf Area Index), soil history, crop type, humidity, and plant stress. For most crops, this band provides good contrast between plants and soil and is widely used in compiling most vegetation indices in agriculture.
Red Edge
This is a very narrow band (700-730nm) corresponding to the entry point of near-infrared light. This is the point where reflectance changes abruptly, from strong absorption in the red to high reflection in the near-infrared. This band is very sensitive to plant stress and provides information about green algae.
• Crop health analysis
• Crop counting
• Water management
Near-Infrared (NIR)
Corresponding to wavelengths in the 700 nm to 1.3 μm range, it has the strongest reflectance of the studied bands. There is a strong correlation between this reflectance and the chlorophyll content of plants. When plants are stressed, very significant changes in reflectance in this band occur. Used in conjunction with the red spectral band, infrared is widely used in compiling most vegetation indices in agriculture.
NIR is sensitive to leaf cell structure and provides key data for monitoring crop health.
• Soil properties and moisture analysis
• Crop health and stress analysis
• Water management
• Erosion analysis
• Crop counting
Healthy vegetation absorbs blue and red light energy to fuel photosynthesis and produce chlorophyll. Plants with more chlorophyll will reflect more near-infrared energy than unhealthy plants. Therefore, analyzing the plant spectrum of absorption and reflection of visible and infrared wavelengths can provide information about plant health and productivity.
Thermal Infrared
Thermal infrared radiation is the part of the electromagnetic spectrum with wavelengths between 3.0 and 20 micrometers, with most remote sensing applications using the 8 to 13 micrometer range. The main difference between thermal infrared and infrared (Color Infrared – CIR) is that thermal infrared is emitted energy sensed digitally, while near-infrared (also called photographic infrared) is reflected energy. Thermal imaging is growing rapidly and plays an important role in fields such as agriculture:
• Nursery monitoring
• Plant physiological analysis
• Irrigation scheduling
• Soil salinity stress detection
• Plant disease detection
• Maturity assessment
• Fruit bruising detection
• Yield prediction
ToF (Time of Flight) 3D Depth Camera Sensors
In addition to multispectral sensors used in agriculture, Time of Flight 3D cameras can help improve data and provide additional data in two ways:
• ToF camera sensors can be used as high-precision passive altimeters, providing additional flight stability to drones when capturing multispectral images.
• ToF 3D depth technology is ideal for measuring volume. These camera sensors can be used to measure the volume of manure and mulch storage.
RGB (Red/Green/Blue)
Visible light is defined as having wavelengths in the range of 400 to 700 nm. In agriculture, high-quality drones with excellent gimbals and cameras can be used for visual farm inspections, elevation modeling, and even plant counting.
There was supposed to be a great video here, but for XXX reasons, I have to say “oh well” again.
Agricultural Multispectral Camera Sensors
Now let’s look at some of the latest multispectral imaging remote sensing sensors, the software required to analyze, process, and output data from the sensors, and the compatible drones on which the sensors can be mounted.
Sentera-3 Multispectral Sensor
Sentera multispectral drone sensors offer superior performance and are very competitive in terms of price, quality, and features. Sentera has 3 multispectral sensors for agricultural drones.
Their sensors produce richly textured color and near-infrared (NIR) image data to provide growers with top-tier NDVI data.
Sentera High-Precision NDVI and NDRE Single Sensors: The sensors are integrated into multiple drone platforms, enabling any grower to quickly and affordably access critical, accurate TrueNDVI™ crop data.
There are two types of high-precision single sensors: Normalized Difference Vegetation Index (NDVI) and Normalized Difference Red Edge (NDRE). Sentera’s high-precision single sensor filters effectively exclude out-of-band leakage that can contaminate measurements, leading to index errors. These advanced sensors make it easier for users to integrate satellite-based index data with drone-based index data. Utilizing high-precision filters, you’ll obtain invaluable NDVI or NDRE information regarding crop health, maturity, and vigor.
The sensors produce clear, detailed RGB or near-infrared (NIR) images, allowing growers to quickly generate Normalized Difference Vegetation Index (NDVI) crop maps. The level of detail provides users with valuable information about crop health and maturity.
• Easy integration into virtually any system.
• Efficiently collects the precise wavelengths needed for accurate NDVI and NDRE measurements
• Low-distortion optics + global shutter technology ensures clear, sharp crop images
• Captures data to create accurate NDVI maps, providing users with a complete crop health report card
• Facilitates customized application of fertilizers, pesticides, and herbicides based on data-driven information
• Seamless data flow to AgVault software for viewing images field-side and taking immediate action
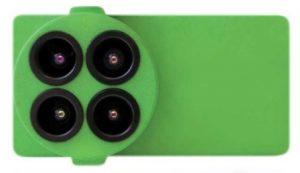
Sentera Quad: This is currently the lightest, smallest, and highest-performing multispectral sensor for drone use.
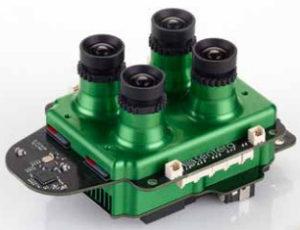
This advanced sensor is capable of identifying six specific light bands, as well as measuring full-spectrum RGB to produce true-color images. The quad-core sensor provides deeper insights into crop health and vigor for agriculture.
• Saves time by capturing full-spectrum RGB images and comprehensive red-edge data in a single flight
• Enables customized application of fertilizers, pesticides, and herbicides based on data-driven information
• Facilitates the discovery and diagnosis of growth problems
• Compatible with AgVault™ for organizing, storing, viewing, and sharing data
Sentera Double 4k Sensor: This agricultural sensor is the smallest and lightest dual sensor available today, and it’s also compatible with any drone. The Double 4K captures high-resolution 12-megapixel images and features an enhanced processor to speed up the delivery of precise crop health imagery to popular stitching tools, including Pix4D and Agisoft.
With improved image resolution and faster processor speeds, users will be completely satisfied with the cropped maps, improved shapes, and stitching. • Livestreams transmit NDVI video to mobile devices via LiveNDVI™ technology
• Simultaneously captures 12MP NDVI and high-resolution RGB images
• Utilizes an enhanced processor for accelerated image download
• Instant image download via WiFi or wired connection
• Easily modifiable, pushing industry technology forward
• Capable of 4K ultra-high-definition video recording
• Seamless integration with AgVault™ software
Parrot Sequoia Multispectral Sensor
The Parrot Sequoia is one of the smallest and lightest multispectral UAS remote sensing sensors on the market. It captures images of crops through four high-resolution, visible and invisible band, enhanced RGB image sensors. This system uses two sensors.
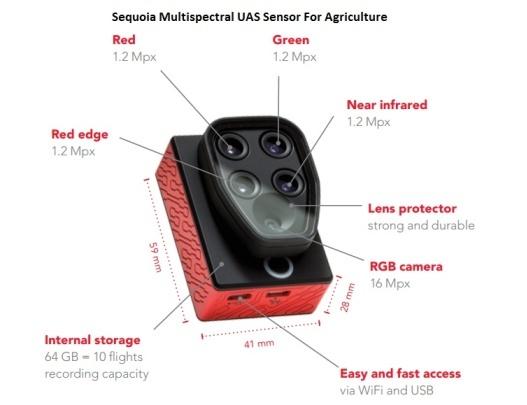
The second sensor is a sunshine sensor, mounted on the back of the drone. During flight, the sunshine sensor continuously senses and records light conditions in the same spectral bands as the multispectral sensor. The light data collected in this way allows for the determination of the values of the identified spectral characteristics.
The Sequoia sensor has its own GPS, IMU, and magnetometer, so it does not rely on the drone’s position data. This may be the best multispectral sensor on the market today. Some of the benefits include:
• Identifying problem areas that require attention and further reconnaissance
• Optimizing fertilization by detecting nutrient deficiency symptoms
• Optimizing pesticide inputs through early detection of biotic stress
• Controlling crop irrigation by identifying areas suspected of water stress
• Estimating crop yield by processing and utilizing agronomic indicators
Tetracam ADC Lite Sensor
The ADC Lite from Tetracam is a lightweight (7 oz) multispectral remote sensing system that serves as an ideal solution for unmanned aerial vehicles. The ADC Lite contains a 3.2-megapixel sensor for capturing visible light wavelengths longer than 520 nm and near-infrared wavelengths up to 920 nm.
Tetracam Multispectral Software
PixelWrench2: This is image processing software included with the multispectral camera that can extract standard vegetation indices (such as NDVI, SAVI, canopy segmentation, and NIR/green ratio) from captured images.
MicaSense RedEdge Sensor
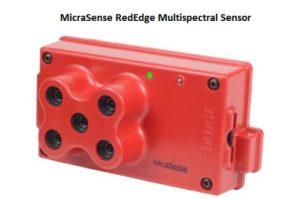
The RedEdge multispectral sensing system simultaneously captures five discrete spectral bands, creating customized indices for tailored applications. The global shutter design creates distortion-free images on every platform. Various interface options, including standalone mode, serial, Ethernet, and WiFi, give RedEdge integrators increased flexibility.
RedEdge’s Downwelling Light Sensor (DLS) measures ambient light conditions during flight for more accurate data under varying light conditions.
RedEdge Drone
RedEdge is ready for integration with any drone. It features flexible interfaces, including Ethernet, serial, and PWM/GPIO triggering. MicaSense is the best software solution for analyzing RedEdge multispectral sensor data.
Airinov multiSPEC 4C Agronomic Sensor
The following are the main features of the Aironov precision agriculture multispectral imaging remote sensing system:
• The multiSPEC 4C sensor measures the reflected light of crops in four different spectral bands: green, red, red edge, and NIR
• 10 phased points of the same type for improved accuracy
• Absolute accuracy of corrected reflection signals
• Integrated lux meter measures light intensity and color
• The sensor also records the geolocation and date of each photo
• Wide-angle lens enables high-speed imaging due to large overlap
• Typical ground sampling distance (GSD) of 5 to 15 cm
• Global shutter provides clear, distortion-free images even in windy conditions
• Adaptable to any drone
Multispectral Imaging Companies
Pix4DMapper AG: This software allows you to take multispectral images and convert them into accurate index maps, such as NDVI and orthomosaics of your fields, providing you with crucial information for quick response, better yields, and operational efficiency.
MicaSense: Provides complete solutions for the processing, storage, presentation, and analysis of multispectral data. They offer technology to efficiently and economically collect crop health information without waiting for satellite passes or paying high costs for manned aircraft. Images can be collected at resolutions measured in inches per pixel. Frequently captured data allows growers and agronomists to map crop health and vigor today and observe changes in crop health over time.
Airinov: Provides drone-based remote sensing solutions for precision agriculture. They help agricultural professionals transform their multispectral images and data into a practical farm management tool. Airinov supports farmers from the initial steps of flight logistics, through agronomic interpretation, and ultimately integrates the maps into tractor guidance systems.
Leave a Reply